Land Subsidence
 In 1993, we contacted Emery Balazs of the National Geodetic Survey. Emery sent what he called a "Profile" of the land surface elevation data along a transect from Raleigh to New Bern. The plot showed the terrain on that transect as represented by 86 geodetic monuments. In general the terrain dropped off from about 328 feet elevation in Raleigh to near sea level in New Bern. Also plotted on the graph were the differences between elevations from the 1968 leveling and the nine other first-order levelings. The differences began to deviate from zero (the expected outcome) starting about 10 miles from Raleigh. They reached their greatest deviation in the Kinston to New Bern interval. The graph below replots the data received from Emery Balazs with a slightly different format:
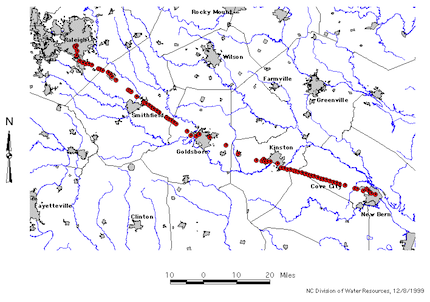
To construct this plot we assume that one end of the profile has been stable. So, Emery held Raleigh stable so other land surface elevations could change. Here is a map of the geodetic monuments used in this plot.
Example rates of subsidence are shown below:
It is a pretty good bet that land subsidence in the North Carolina coastal plain is due to heavy pumping of groundwater from
aquifers referred to in various places in these web pages, namely the Black Creek and Upper Cape Fear aquifers. This last plot has some very interesting testimony to that theory. The rate of subsidence at Cove City increased in the second interval covered in the leveling runs (from 1968 to 1978) from 0.17 to 0.25 inches per year. This can be explained by New Bern bringing their Cove City water supply wells on-line in the late 1960s. Higher rates of land subsidence are associated with higher groundwater withdrawal rates.